
2018 Mergers & Acquisitions – Photonics
2018 was a record year for the Merger & Acquisition (M & A) market worldwide as a whole and for photonics in terms of both deal value and deal volume.
In 2018, buyers address the challenges of slower growth, an abundance of investment capital, advances in digital and mobile technologies and government intervention with M & A. Buyers are acquiring companies to open new markets, enhance capabilities and implement new business models. In the photonics industry and vertical markets employing photonics technologies, those acquired to enhance capabilities are predominantly lower middle market companies with new technologies and/or innovative business models.
The majority of buyers are strategic, but there is an unprecedented higher concentration of financial buyers. When a company is acquired to strategically enhance a buyer’s capabilities or product lines, as is the trend for 2018, the strategic premium gained in valuation lacks the cost synergies of when a company is acquired to scale an existing business. So, in this scenario, financial buyers are competitive with strategic buyers.
In 2018, because great companies are rare and sales processes are competitive, buyers with a core competence in M & A and strategic marketing are dominating. These strategic and financial buyers know their markets and are able to act quickly.
The Transactions
There were 53,480 transactions worth $3.5trillion announced globally. Of that, CERES identified and researched 842 transactions with reported value of $80billion in the photonics industry and vertical markets employing photonics technologies as core differentiators.
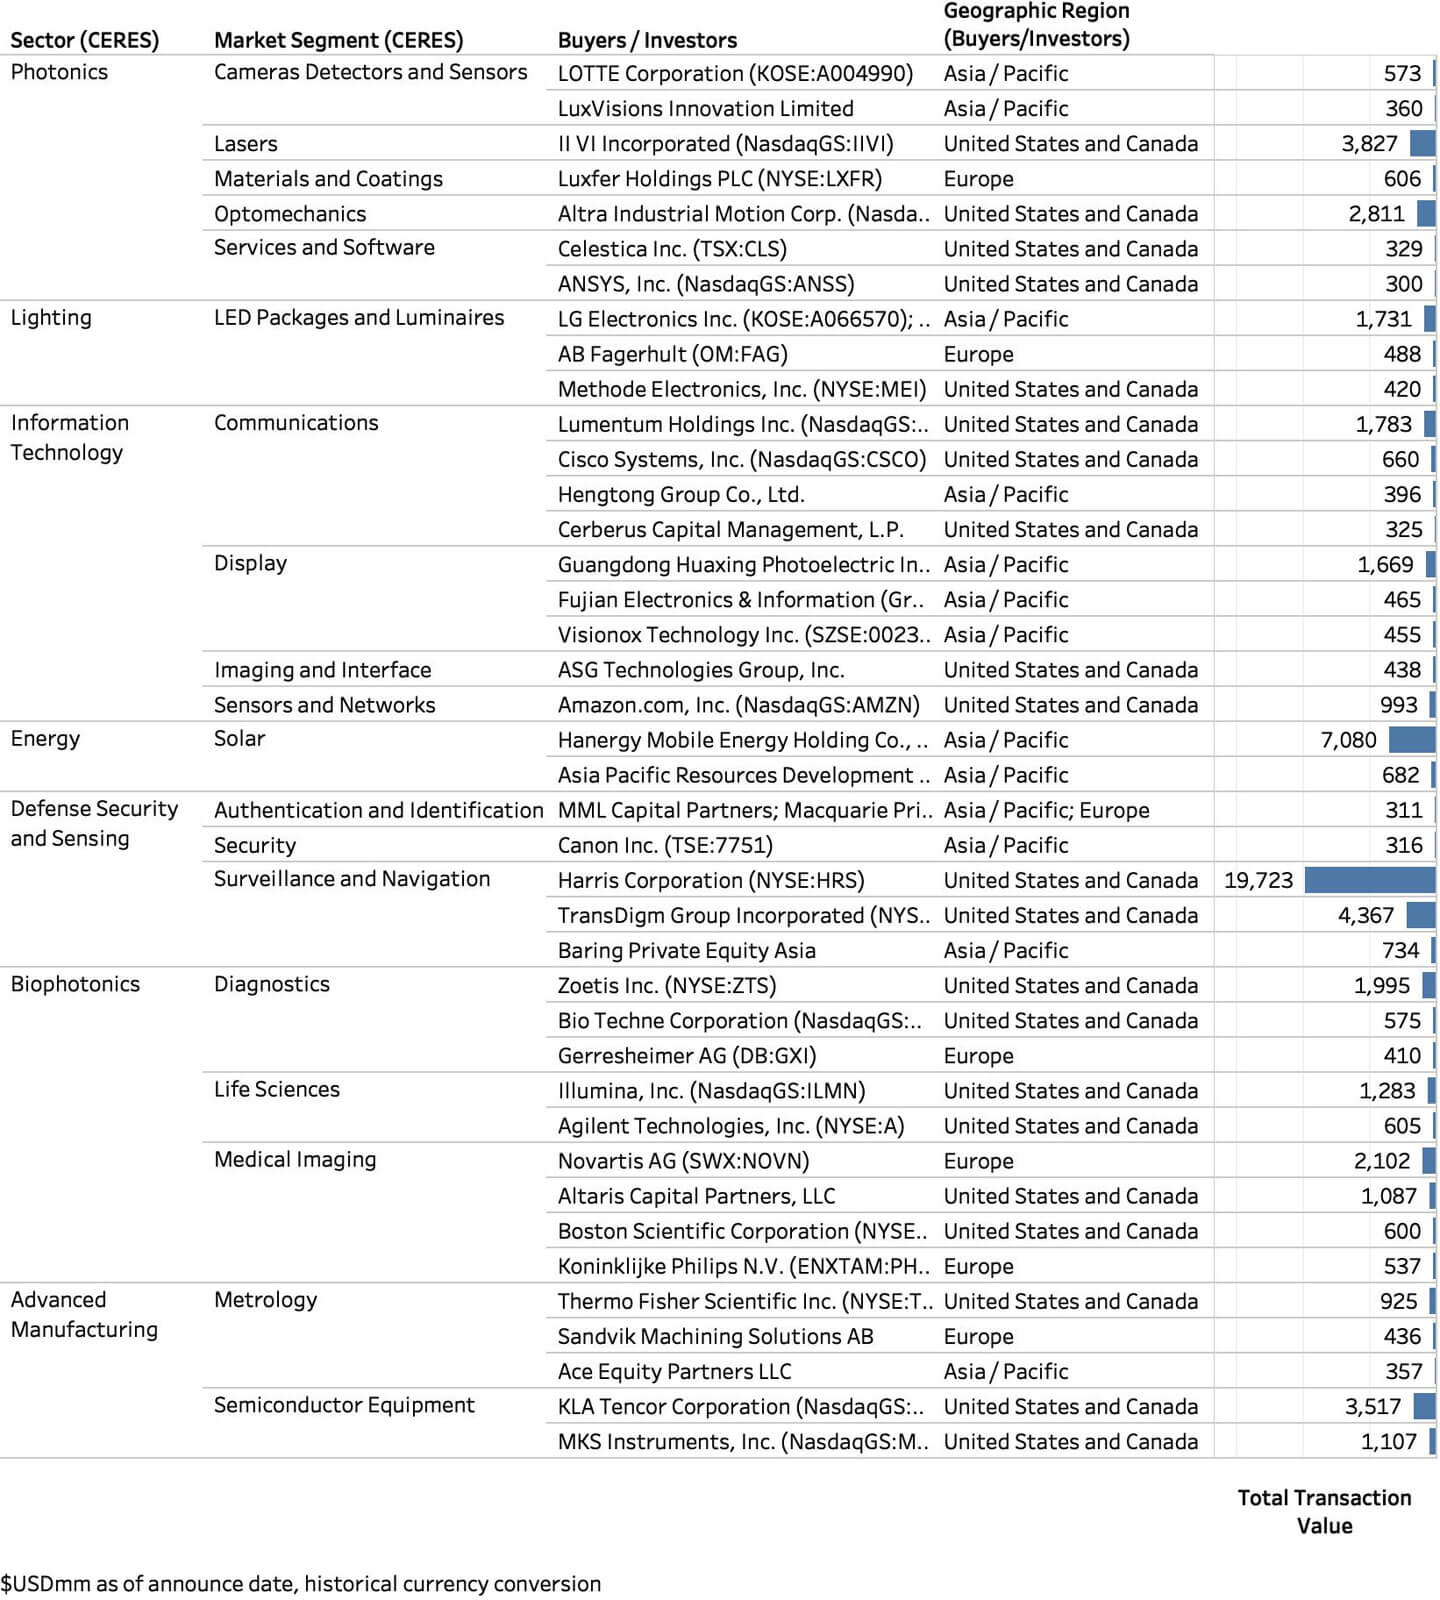
M & A Transaction Volume and Value by Sector

M & A transactions are researched with closing or announce dates from January 1 to December 31, 2018. Transactions volumes, values, geographies, and market segments are analyzed. Values are in $US at historical rates of exchange. Implied Enterprise Value (IEV) is defined as the total consideration to shareholders (adjusted for % acquired) plus earnouts plus rights/warrants/options plus size adjustment plus net assumed liabilities.
Follow this link to access detail for transactions analyzed in this article.
Photonics M & A Transaction Detail
M & A Transaction Volume and Value by Market

Activity
The LED Packages and Luminaires, Materials and Coatings, Advanced Manufacturing Metrology and Display segments see the most activity by number of transactions.
In 2018, the total and average Enterprise Value of the 842 transactions reporting financial data were $80billion and $407mm – record highs over 2017 record high.
Because of continued industry consolidation, the Defense Security and Sensing and Energy sectors see a high concentration of Large Market (>$1000mm) transactions. Consistent within these markets served, the Advanced Manufacturing and Biophotonics sectors see higher concentrations of Lower Middle Market ($25mm to $100mm) transactions.
Photonics Core Technology Companies
In 2018, there were 170 M & A transactions announced for photonics core technology targets. These companies supply lasers, optics, detectors, optomechanics, software, materials and coatings and accounted for $11.5billion of total publicly reported transaction value.
2018 M & A – Photonics
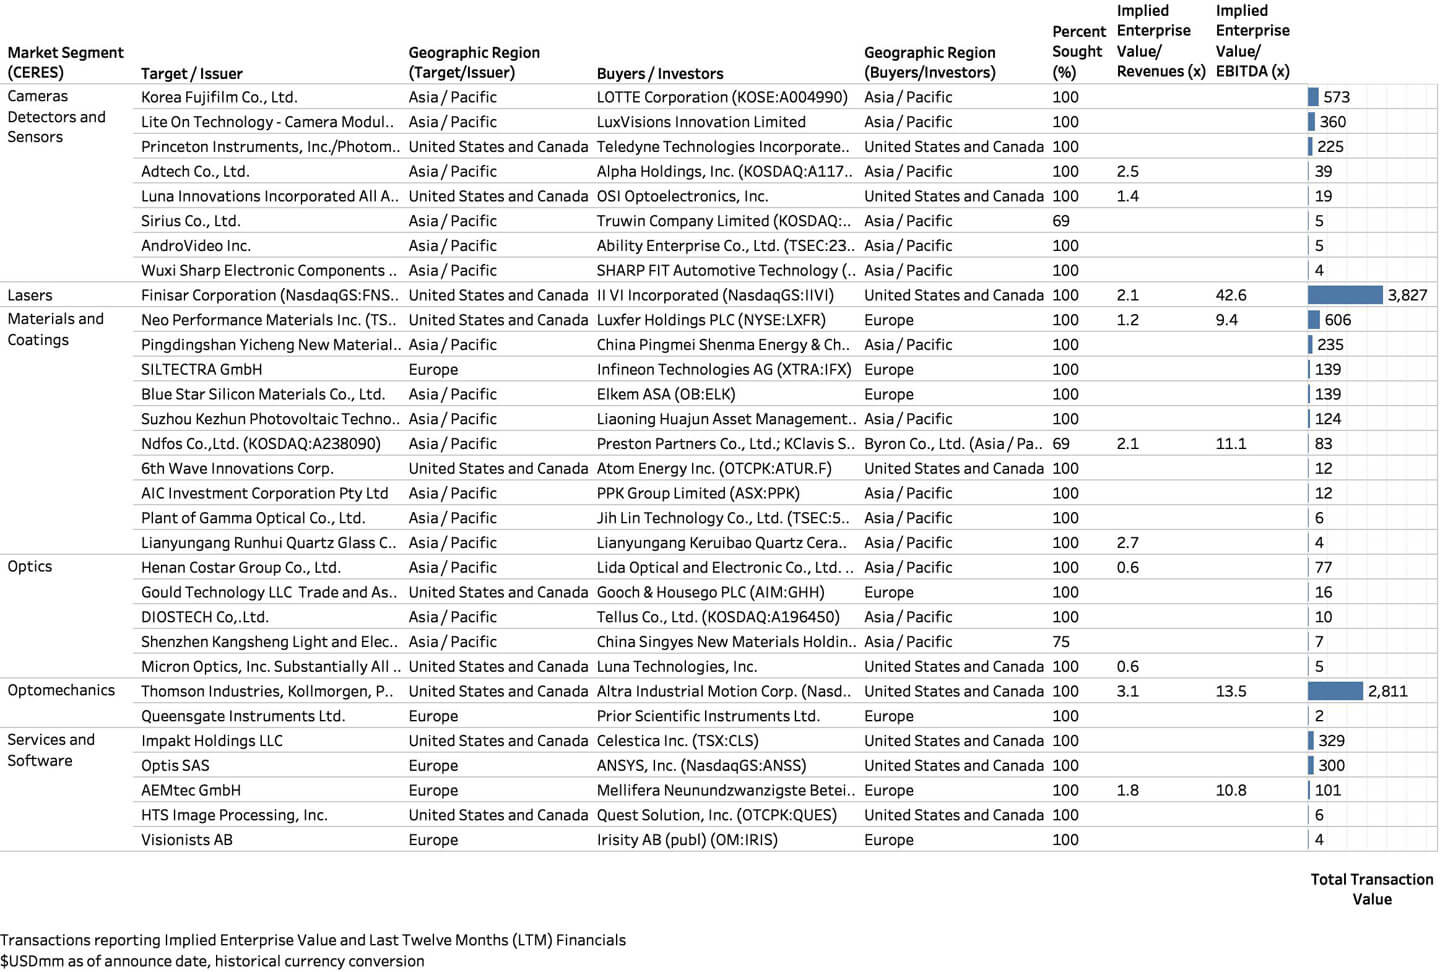
In 2018, the largest announced transaction ($3.8billion) and highest IEV/EBITDA valuation (42.6x) in Photonics was the acquisition of Finisar Corporation by II-VI Incorporated. Implied Enterprise Value (IEV) includes approximately $500mm debt.
The second largest transaction ($2.8billion) and highest IEV/EBITDA valuation (13.5x) in Photonics was the acquisition of Thomson Industries, Kollmorgen, Portescap and Jacobs Vehicle Systems by Altra Industrial Motion Corp. (NasdaqGS:AIMC) from Fortive Corporation (NYSE:FTV). Kollmorgen provides high precision motion control solutions for optical systems.
Not including the Finisar transaction, the minimum and maximum IEV/EBITDA in Photonics was 9.4x and 13.5x respectively. Not including transactions for less than 69% equity stake and the Pacer Technologies transaction, the minimum, median and maximum IEV/Revenue in Photonics was 0.6x, 2.1x and 3.1x respectively.
Lasers
Market leaders in Lasers are acquisitive in 2018. Consolidation continues as buyers horizontally integrate smaller laser companies with complementary product lines and merge with competitors.
Horizontal Integration in Lasers
- Oxide Corporation acquires the vacuum ultraviolet laser business of Lumeras (Japan), producer of high-photon-energy laser sources used in material science research
- Novanta acquires 24% of Laser Quantum (UK), manufacturer of cw IR and femtosecond laser equipment for research, medical diagnostics and industrial manufacturing for $45.7M
- Trumpf acquires AMPHOS (Germany), manufacturer of ultrashort pulse laser systems for glass micromachining and coherent EUV generation
- Trumpf acquires Philips Photonics (Netherlands), manufacturer of VCSEL’s
- OSRAM acquires Vixar (US), manufacturer of VCSEL’s, from Phoenix Venture
- II-VI acquires Finisar (US), supplier of VCSEL’s and active optical subassemblies to communications and automotive for $4.0B (33.6x EBITDA)
- Lumentum acquires Oclaro (US), provider of optical network components, for $1.8B (10.4x EBITDA)
Referencing “Photonics in Today’s Transformative Age” {link to article}, market leaders in Lasers are also seizing opportunities to create new value for their customers and reshape their businesses to include more services and information technology.
Forward Vertical Integration in Lasers
- Coherent acquires R. Lasertechnologie (Germany) manufacturer of laser welding machines, for $250M
- IPG Photonics acquires Genesis Systems (US), integrator of robotic arc welding systems for $115M
- Jenoptik acquires OTTO Vision, manufacturer of optical inspection systems based on industrial image processing and OVITEC, developer of application-specific image processing software
- Trumpf acquires Teufel Solutions (Germany), supplier of IT for material processing systems
Backward Vertical Integration in Lasers
- Metrohm acquires Innovative Photonic Solutions (US), supplier of stabilized, single frequency lasers
- Coherent acquires Ondax (US), manufacturer of holographic optical filters and wavelength-stabilized laser
Valuations
Few transactions report financials, because there are public reporting requirements if a transaction does not have material near term impact on financial statements. Regardless, M & A transaction data is highly relevant to understand market dynamics and buyer behavior.
Of the identified and researched transactions, 140 report valuation metrics. Values are in $US at historical rates of exchange. Implied Enterprise Value (IEV) is defined as the total consideration to shareholders (adjusted for % acquired) plus earnouts plus rights/warrants/options plus size adjustment plus net assumed liabilities.
2018 M & A Valuation Metrics
Implied Enterprise Value / EBITDA Multiples

2018 M & A Valuation Metrics
Implied Enterprise Value / EBITDA Multiples

2018 M & A Valuation Metrics
Implied Enterprise Value / Revenue Multiples

2018 M & A Valuation Metrics
Implied Enterprise Value / Revenue Multiples

Leading the pack on Implied Enterprise Value / EBITDA for acquisitions of 100% equity are Mitek Systems, Inc. (US), developer of mobile image capture and identity verification software; Cogentix Medical, Inc. (US), supplier of fiberoptic and video endoscopes; Shanghai Bandweaver Technologies Co., Ltd. (China), manufacturer of fiber optics sensors; Abaxis, Inc. (US), provider of portable blood analyzers; and CoAdna Holdings, Inc. (US), supplier of optical networking components.
Leading the pack on Implied Enterprise Value / EBITDA for acquisitions of less than100% equity are Y-Optics Manufacture Co., Ltd. (S. Korea), medical device supplier of 3D whole body scanners (136x); Fourth-Link Inc. (S. Korea), provider of 3D head mounted display glass products and micro-displays (131x) and Mildex Optical Inc. (Taiwan), supplier of lenses and touch panel human interfaces (96x).
2018 M & A Valuation Metrics
Implied Enterprise Value Multiples

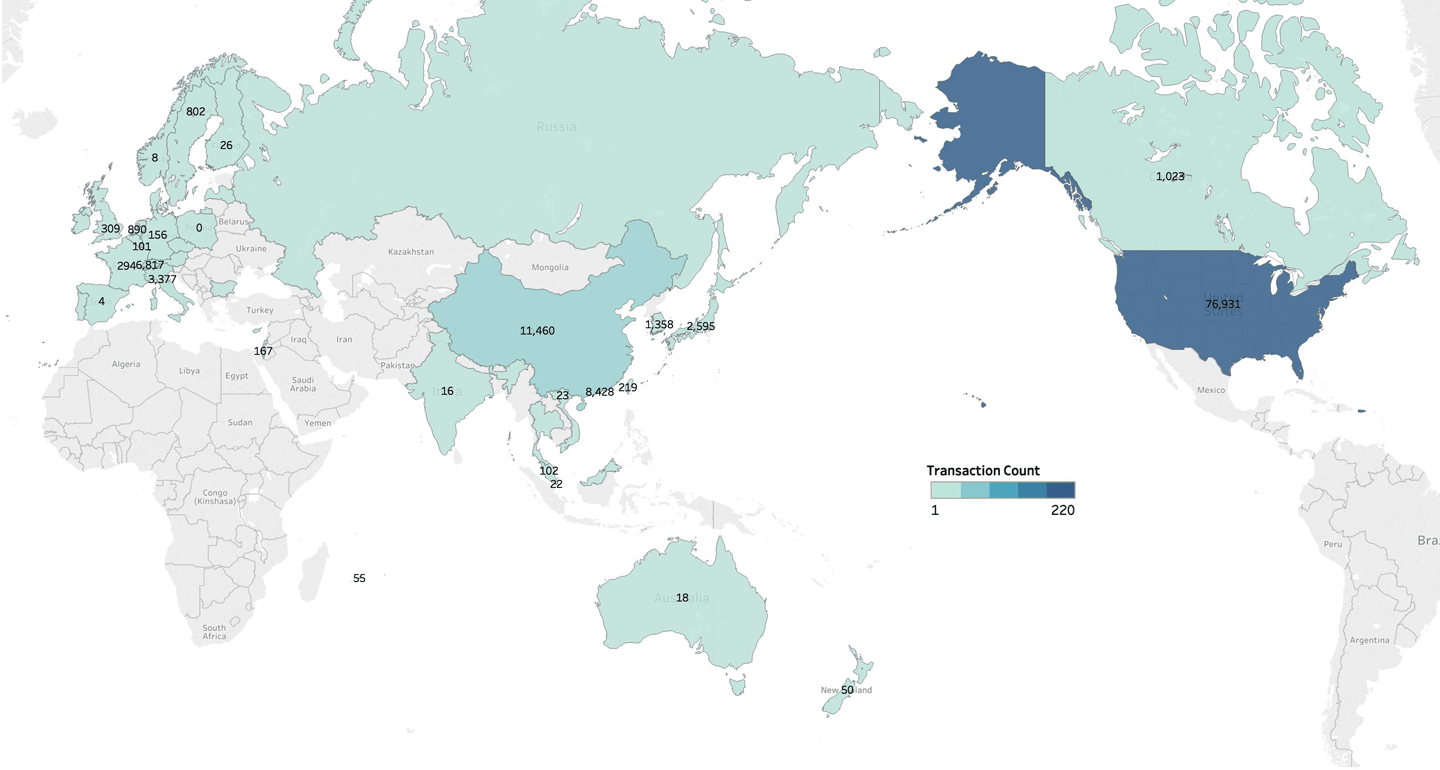
Geographies
Geographically, the most significant trend over the previous 5 years is an acceleration of cross-regional acquisitions. Prior to 2018, buyers are acquiring more targets in geographical areas outside their own. That trend lost its momentum in 2018.
Historically, United States and Canada, as a geographical region, experience the most buy and sell side activity. Since 2015, we see higher concentrations of targets in Asia/Pacific and Europe. In 2018, Asia/Pacific surpasses United States and Canada by transaction count. Because of consolidation of market leaders, United States and Canada still see the highest concentration of total value of M & A activity.
MA Transactions by Target Geography

MA Transactions by Target Geography

Since 2015, we see higher concentrations of buyers in Asia/Pacific and Europe. In 2018, Asia/Pacific surpasses United States and Canada by transaction count.
M & A Transactions by Buyer Geography

M & A Transactions by Buyer Geography

On a country basis, United States still has, by far the most buy and sell side activity in photonics. However, activity in China and South Korea is steadily increasing year over year.
M & A Transaction Volume & Value by Buyer Country
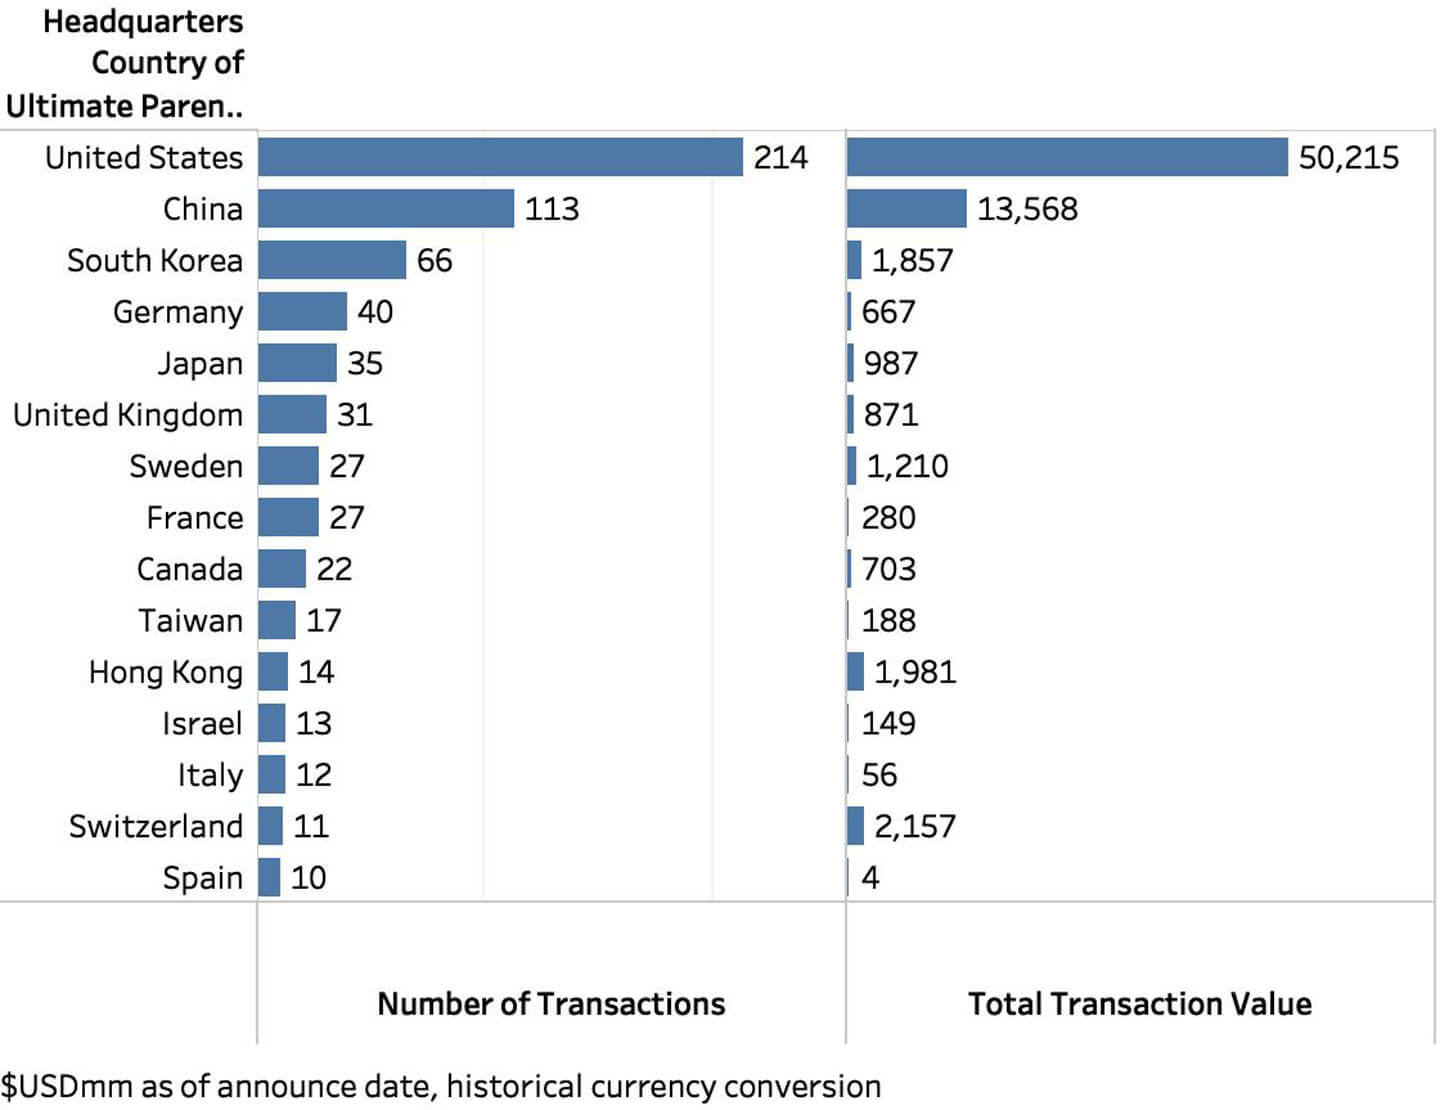
Trending down from 25% in 2014 and 18% in 2015, more transactions represent buyers acquiring targets inside their geographical region. Reference article, “Foreign Investment in US Photonics Technologies”.
Most Active Buyers
Strategic buyers are by far the most active – acquiring small and middle market companies across a wide breadth of photonic technology enabled market segments. Since 2016, new buyers are continuously entering the most active buyers lists. In prior years, the lists were dominated by many of the same buyers.
In 2018, the most active buyer by number of transactions is Bruker Corporation. Bruker acquired three Biophotonics companies: JPK Instrument AG, manufacturer of nano-analytical life sciences instruments; Sierra Sensors GmbH, supplier of biosensor based analytical instruments; and IRM2 who is developing high-speed IR microscopes and two Advanced Manufacturing companies: Alicona Imaging GmbH, manufacturer of 3D surface measurement solutions; and Anasys Instruments who supplies an atomic force microscope-based IR spectroscopy platform for measuring nanoscale material properties.
Following is Agilent Technologies, Inc. who acquired four Biophotonics companies: ACEA Biosciences, Inc., developer of label-free, real-time diagnostic sensors; LaserGen, Inc., a biotechnology company commercializing tools for next generation gene sequencing; Luxcel Biosciences, Ltd., provider of phosphorescent probes; and Advanced Analytical Technologies, Inc., supplier of genetic analysis systems.
Ningbo Gaoguang Enterprise acquired equity stakes in two Materials and Coatings companies – Nanjing Yijing Optoelectronics and Nanjing Yijing Energy who supply sapphire and LED materials; Nanjing Nanchuan Laser Equipment who supplies laser communications components; and Nanjing Langhui Optoelectronics who supplies Display components.
2018 Most Active Buyers by Volume
In 2018, the most active buyer by volume is Harris Corporation who acquired target employing photonics for navigation and surveillance, L3 Technologies. Following are 26% stake in Thin Film Power Group Limited who manufactures amorphous silicon-based and copper indium gallium selenide based thin film solar photovoltaic modules; KLA-Tencor Corporation’s acquisition of Orbotech Ltd., provider of optical metrology and laser material processing tools; and II-VI’s acquisition of Finisar.
2018 Most Active Buyers by Count

CERES sources transaction data from public sources. CERES analysis and data are subject to errors and omissions. Accuracy of information is responsibility of user.